BDA-602 - Machine Learning Engineering
Dr. Julien Pierret
Lecture 7
Features?
-
Features are inputs that help us predict some outcome
- Features = Predictors
- Outcome = Response / Label
-
Feature types
-
Continuous
- money
- time
- height
- distance
-
Categorical
(Discrete)
- gender
- zipcode
- state
- color
- Social Security Number
-
Continuous
›
Continuous Features
- Easy to use
-
Nothing really needs to be done
- Transformations
- Just improving it
›
Categorical Features
- Harder to use
- Two different types
›
Categorical to usable
-
RED ,GREEN ,BLUE -
One-hot
encoding
-
Most common
- for model building -
RED :[1, 0, 0] -
GREEN :[0, 1, 0] -
BLUE :[0, 0, 1] -
PURPLE :[1, 0, 1]
-
-
Most common
-
Dummy
encoding
-
Have a control group
- testing for differences among groups -
RED :[0, 0] -
GREEN :[1, 0] -
BLUE :[0, 1]
-
Have a control group
›
Categorical to usable
-
Effects
Encoding
- Comparing one group to all groups
- Comparison made at the mean of all groups combined
- Group of least interest coded with -1
Nationality C1 C2 C3 French 0 0 1 Italian 1 0 0 German 0 1 0 Other −1 −1 −1
›
Categorical to usable
-
Contrast
Coding
- The sum of the contrast coef. equal zero.
- The difference between the sum of the + coef. and the sum of the - coef. equals 1.
-
Coded variables should be orthogonal
Nationality C1 C2 French +0.25 +0.50 Italian +0.25 −0.50 German −0.50 0 - Hypothesis 1: French and Italian persons will score higher on optimism than Germans (French = +0.25, Italian = +0.25, German = −0.50).
- Hypothesis 2: French and Italians are expected to differ on their optimism scores (French = +0.50, Italian = −0.50, German = 0).
- Nonsense Coding
›
Categorical - Binary encoding
| Color | Binary 1 | Binary 2 | Binary 3 |
| 0 | 0 | 0 | |
| 0 | 0 | 1 | |
| 0 | 1 | 0 | |
| 0 | 1 | 1 | |
| 1 | 0 | 0 | |
| 1 | 0 | 1 | |
| 1 | 1 | 1 |
›
Categorical - Ranking
- Figure out some way to rank them that makes sense
| Color | Ranking |
| 1 | |
| 2 | |
| 3 | |
| 4 | |
| 5 | |
| 6 |
- Pattern?
🌈
›
Categorical - Embedding
- Useful in Neural Networks
-
Encode categoricals into a set of continuous numbers
- You get to pick the number of continuous numbers
- Rule of thumb $\sqrt[4]{n}$ (where $n$ number of distinct categories)
- Neural Networks don't work well with one-hot encodings
- Word Embedding
›
Categorical - Vector
-
Something new
- Take all categorical fields and generate a vector
-
Sort of like
word2vec - Hopefully I'll find a good coding of it
›
Coming up with Features
- Feature engineering is more important than modeling!
- A better model can raise accuracy by centimeters
- Better predictors can raise accuracy by meters
-
Feature Engineering
-
Model only as good as what you put into it
- New ways to look at the data
- New data
-
One of my favorite parts of the job
- Let your imagination run free
- When I interview I dig heavily into this
- Unsupervised learning
-
Story-time
-
 "6k+ Feature Bank"
-
 "Data Bank"
-
-
Model only as good as what you put into it
›
Horse Racing
-
Running Style
- Early (E)
- Early Presser (EP)
- Presser (P)
- Sustained? (S)
-
Look at historical races 🎰:

- Starting Pos, 1st / 2nd / final Call Position
- 1st / 2nd / Final Call Beaten Length
- Assign the horses one of the running styles
- Labeled 40 races this way
- A decision tree modeled it perfectly!
›
Baseball
-
Elo rating system
-
Used in chess to rank players
-
Baseball statistics
- Baseball nerds everywhere 🤓
- Use it to your advantage
›
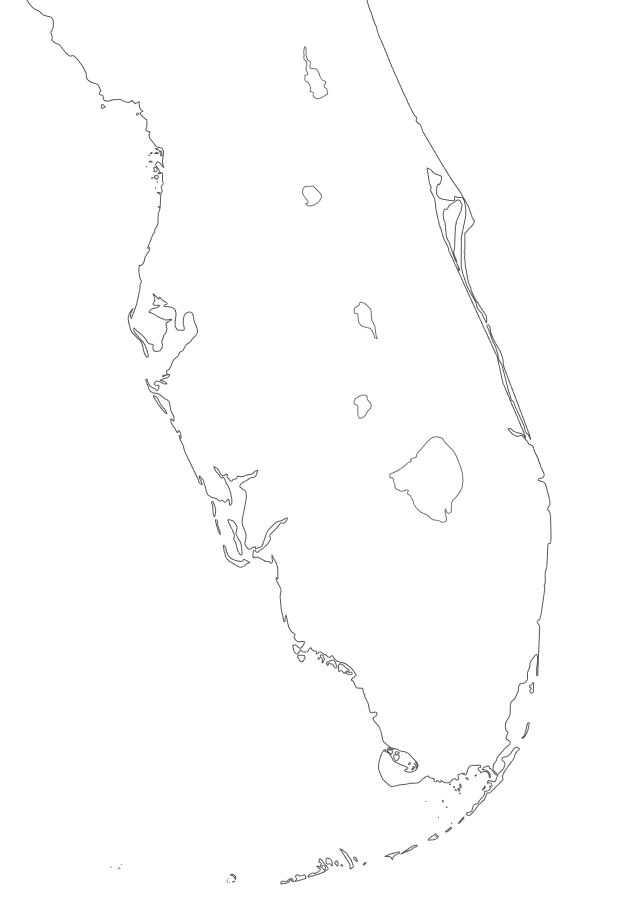
Automated Valuation Models (AVM)
- Predicting apartment complex values in Florida
- Address to lat/lon
-
Shapefiles
with coasts
- Line segments of the coastline
-
Calculated shortest distance to coastline
- AVM goes up closer to coast
- Dependant on area
›
Document Scanning Predictions
- Predicting "Date Due" from an invoice
-
Optical Character Recognition (OCR)
- Know where every character/word is on the page
- Find correct "Date Due" on the document
-
Generate a
Heatmap
of correct "Date Due" pixels
- Scale all points so 1 is the highest number

-
Predictor: For any candidate date
- average the value of the "pixels" it covers from the heat map
- Higher the number the better
›
Too many Categories
-
Fraud Model
-
Unsupervised on all the predictors
-
Number of clusters in 1000s
- Crazy!
-
Crazy Brilliant
- Fraud is a rare event
- Most clusters were garbage
- Others full of fraud
- Inspected them
- Grouped these bad clusters together
- Extra boolean feature fed into the final fraud model
-
Number of clusters in 1000s
Bonus - Proximity to an internation airport
›Failures > Success
- What features are good?
- Plot it!
-
Rank features from best to worst
- p-value / Z-score (with caveats)
- Binning and difference with Mean (weighted / unweighted)
- Random Forest Variable Importance Ranking
›
Plotting
-
Crazy Important 🧼📦:

- See the actual relationship
-
Predictor / Response type Dependant
-
Response: Boolean / Categorical
-
Predictor: Boolean / Categorical
- Heatplot
-
Predictor: Continous
- Violin plot on predictor grouped by response
- Distribution plot on predictor grouped by response
-
Predictor: Boolean / Categorical
-
Response: Continuous
-
Predictor: Boolean / Categorical
- Violin plot on response grouped by predictor
- Distribution plot on response grouped by predictor
-
Predictor: Continuous
- Scatter plot with trendline
-
Predictor: Boolean / Categorical
-
Response: Boolean / Categorical
›
Categorical Response / Categorical Predictor
Categorical Response / Categorical Predictor
Categorical Response / Continuous Predictor
Categorical Response / Continuous Predictor
Continuous Response / Categorical Predictor
Continuous Response / Categorical Predictor
Continuous Response / Continuous Predictor
An extra reason to plot
-
Target Leakage
-
Nostradamus
Variables

- Accidentally leak the response into the predictor
-
Nostradamus
Variables
-
Obvious when plotted
- If model is too good
- Always check the best performing predictors
- Need to rank predictors
›
Random Forest
-
Variable Importance
- Great for variable ranking
- sklearn has this as feature_importances_
- Good segwe into decision trees
›
Decision Trees
-
How do they work?
-
Look at all the data for a branch
- Look at all the predictors, how do we maximize
- Gini
- Information Gain (Entropy)
- Split on it
-
Repeat until we have everything categorized correctly or hit
stopping criteria
-
Overfits!
- Fit to the noise
- Don't over grow
-
Pruning
-
Cross Validation
- Where to cut branches
-
Cross Validation
-
Overfits!
-
Look at all the data for a branch
-
sklearn.tree.DecisionTreeClassifier
›
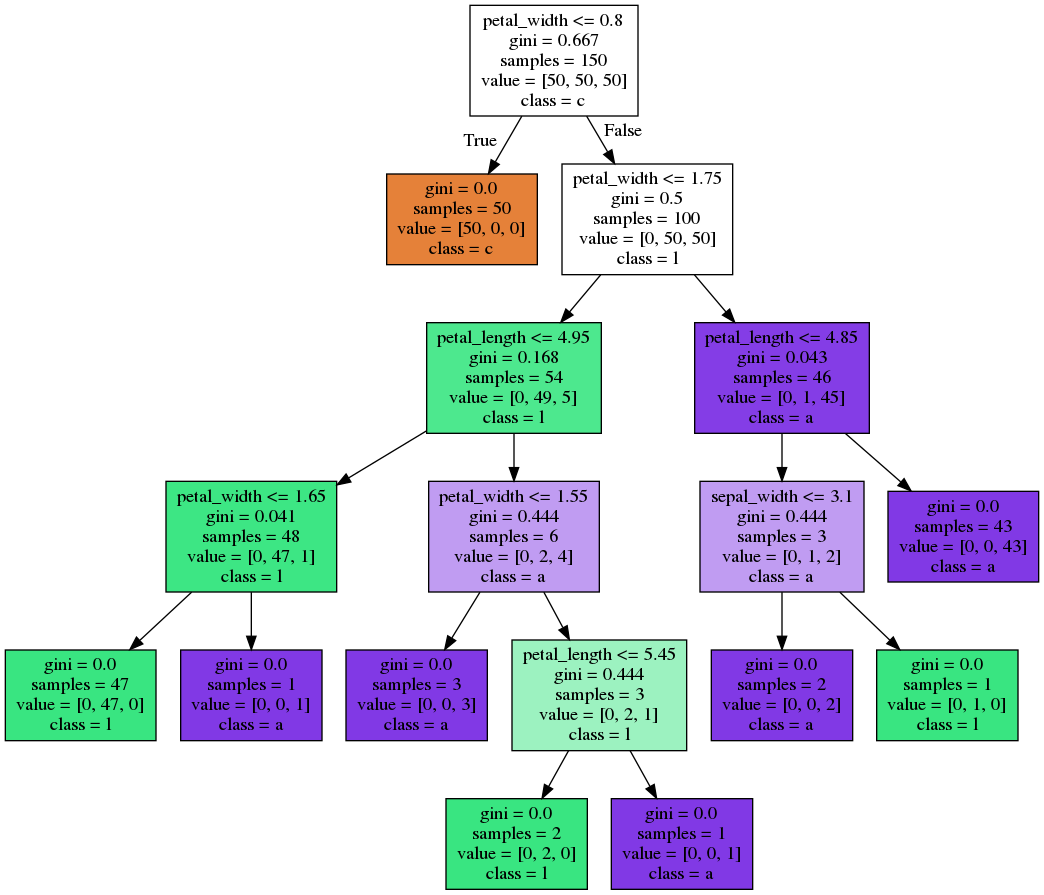
Decision Tree - Building
›
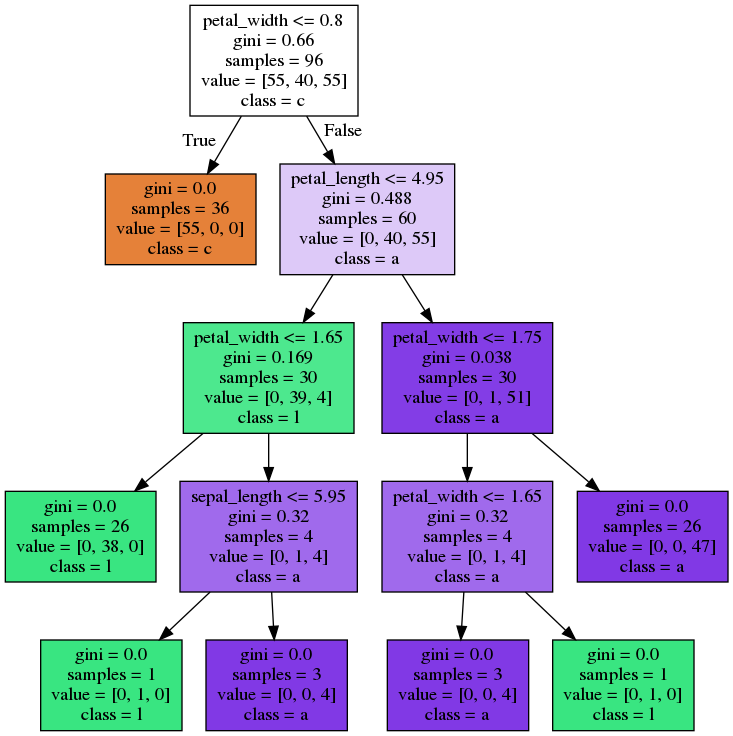
Fisher's Iris Data set
-
150 observations
- 50 samples from each of the species of Iris
- 4 predictors
›
Decision Tree - Building
Decision Tree - Original Dataset
              ********************************************************************************
              Original Dataset
              ********************************************************************************
                  sepal_length  sepal_width  petal_length  petal_width           class
              0             5.1          3.5           1.4          0.2     Iris-setosa
              1             4.9          3.0           1.4          0.2     Iris-setosa
              2             4.7          3.2           1.3          0.2     Iris-setosa
              3             4.6          3.1           1.5          0.2     Iris-setosa
              4             5.0          3.6           1.4          0.2     Iris-setosa
              ..            ...          ...           ...          ...             ...
              145           6.7          3.0           5.2          2.3  Iris-virginica
              146           6.3          2.5           5.0          1.9  Iris-virginica
              147           6.5          3.0           5.2          2.0  Iris-virginica
              148           6.2          3.4           5.4          2.3  Iris-virginica
              149           5.9          3.0           5.1          1.8  Iris-virginica

              [150 rows x 5 columns]
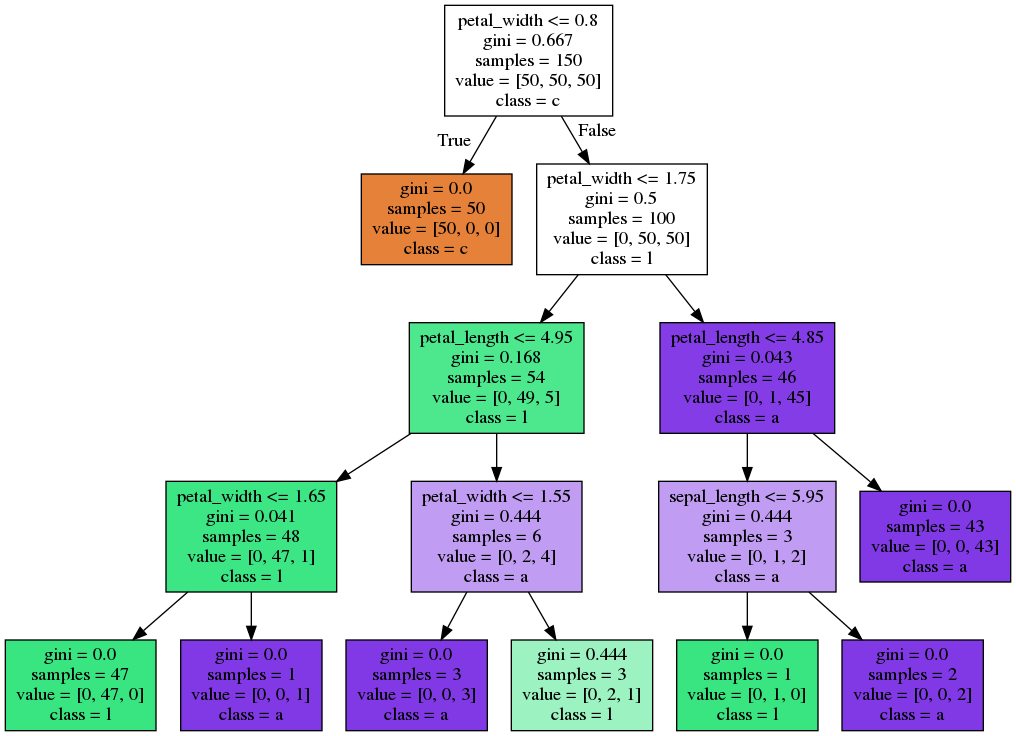
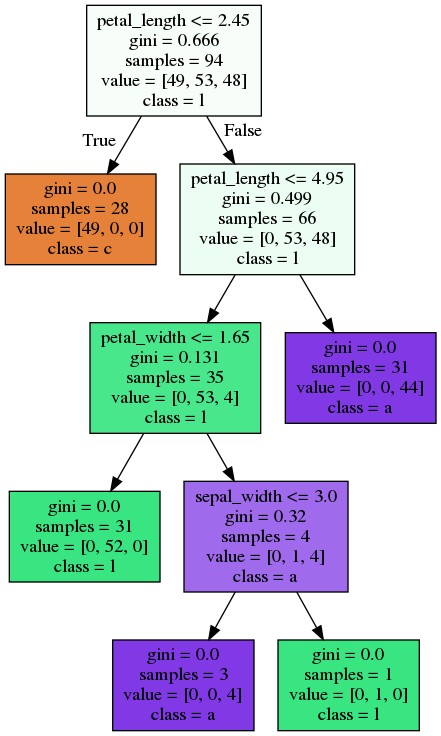
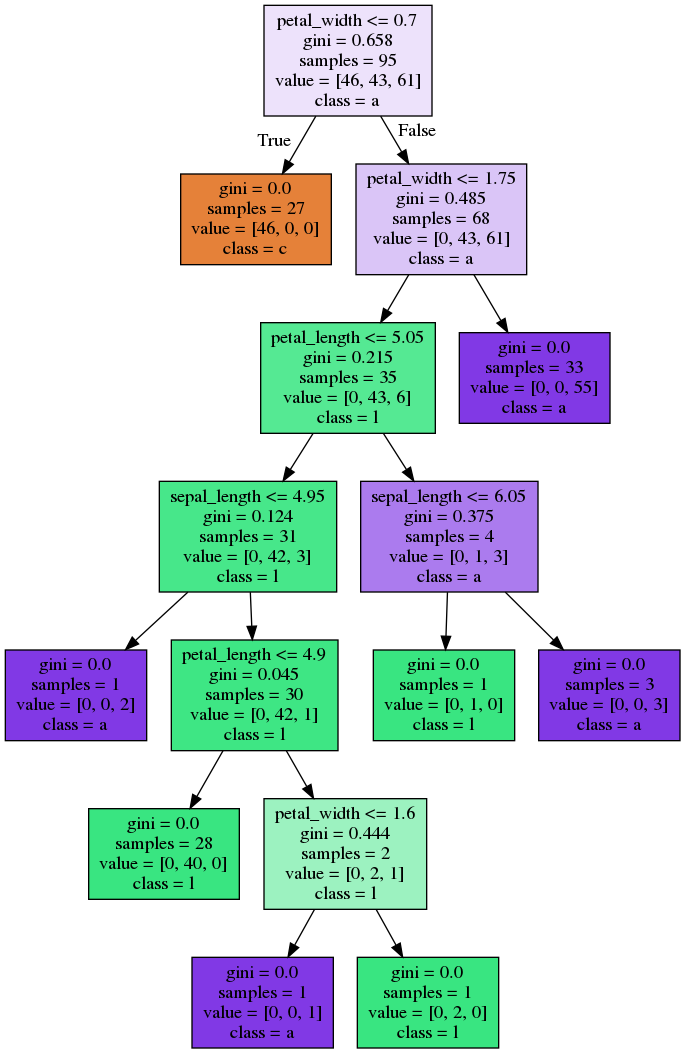
Decision Tree - Building
Decision Tree - Unpruned Tree
Decision Tree - Pruning
Decision Tree - Cross Validation Score
| criterion | max_depth | score | |
|---|---|---|---|
| 0 | gini | 1 | 0.666667 |
| 1 | gini | 2 | 0.933333 |
| 2 | gini | 3 | 0.960000 |
| 3 | gini | 4 | 0.966667 |
| 4 | gini | 5 | 0.960000 |
| 5 | gini | 6 | 0.960000 |
| 6 | entropy | 1 | 0.666667 |
| 7 | entropy | 2 | 0.933333 |
| 8 | entropy | 3 | 0.960000 |
| 9 | entropy | 4 | 0.953333 |
| 10 | entropy | 5 | 0.953333 |
| 11 | entropy | 6 | 0.953333 |
Decision Tree - Plotting the score
Decision Tree - Pruning Plot
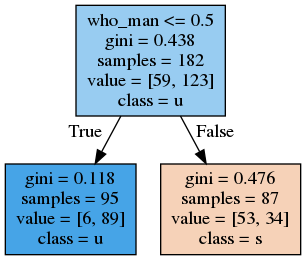
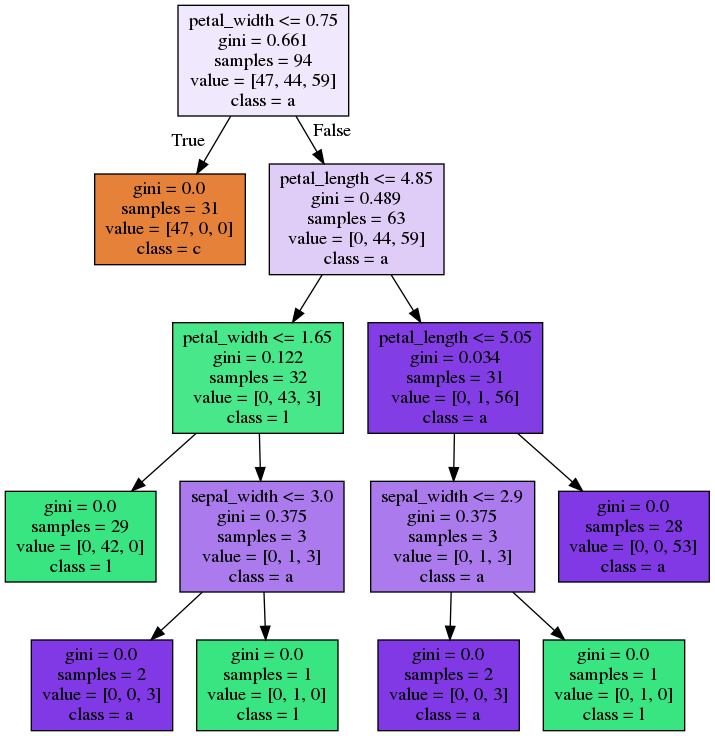
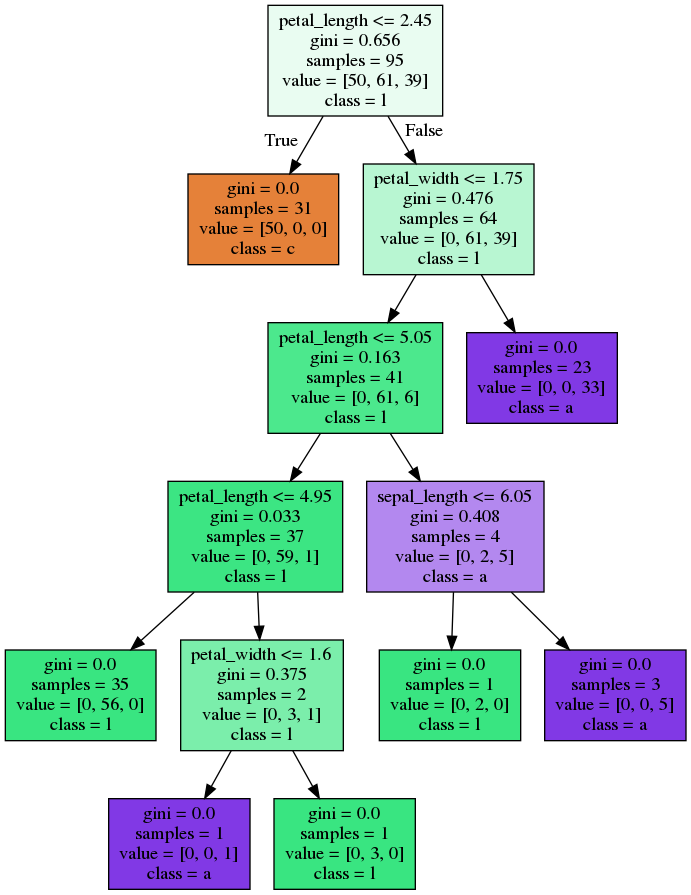
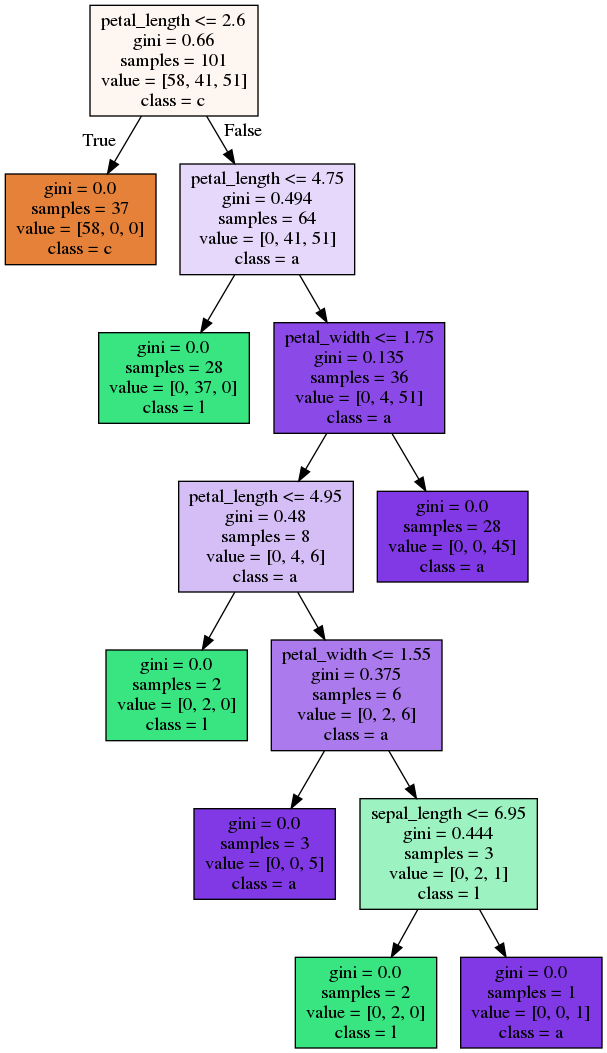
Decision Tree - Plotting the optimal tree
Decision Tree - Pruned Tree
Decision Tree - Overfitting
- Probably the biggest problem
- Running this on the titanic dataset
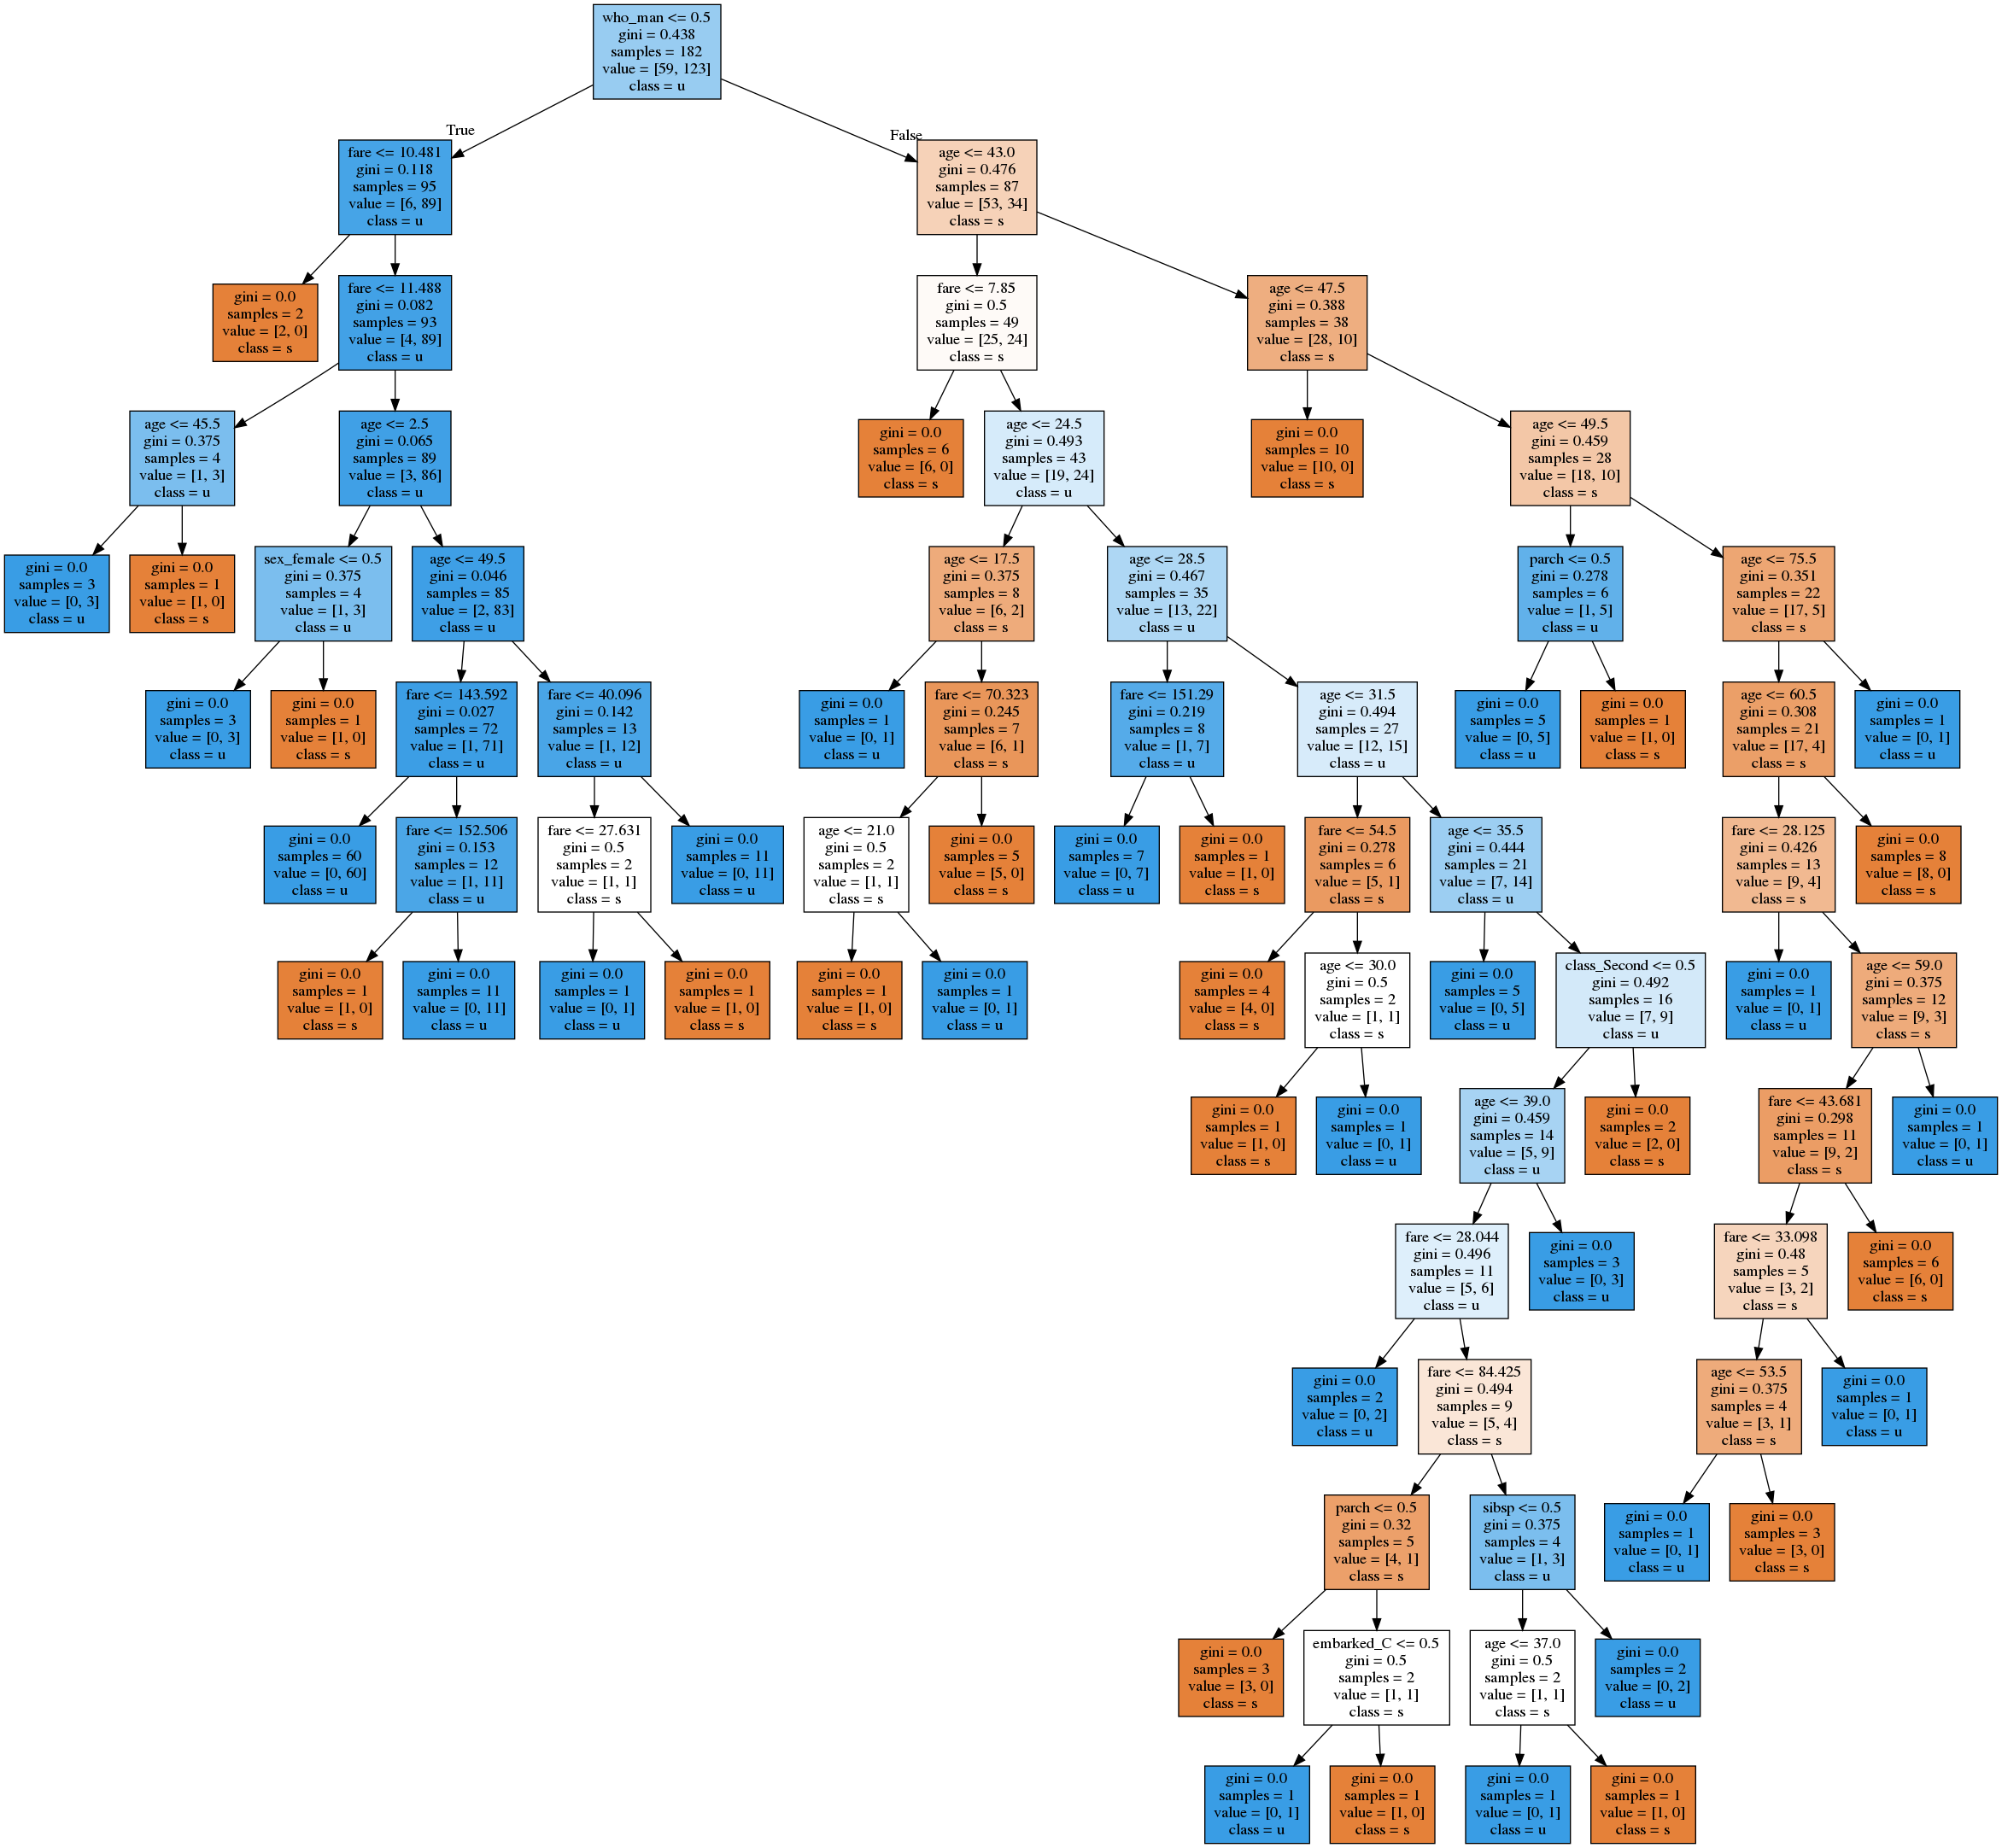
Titanic - Cross Val Negative Mean Squared Error
Bootstrap Aggregating (Bagging)
-
Bootstrap
- Sample with replacement from dataset
-
Aggregating
- Build many trees and agregate their results
-
sklearn.ensemble.BaggingClassifier- Wrapper for any classifier
›
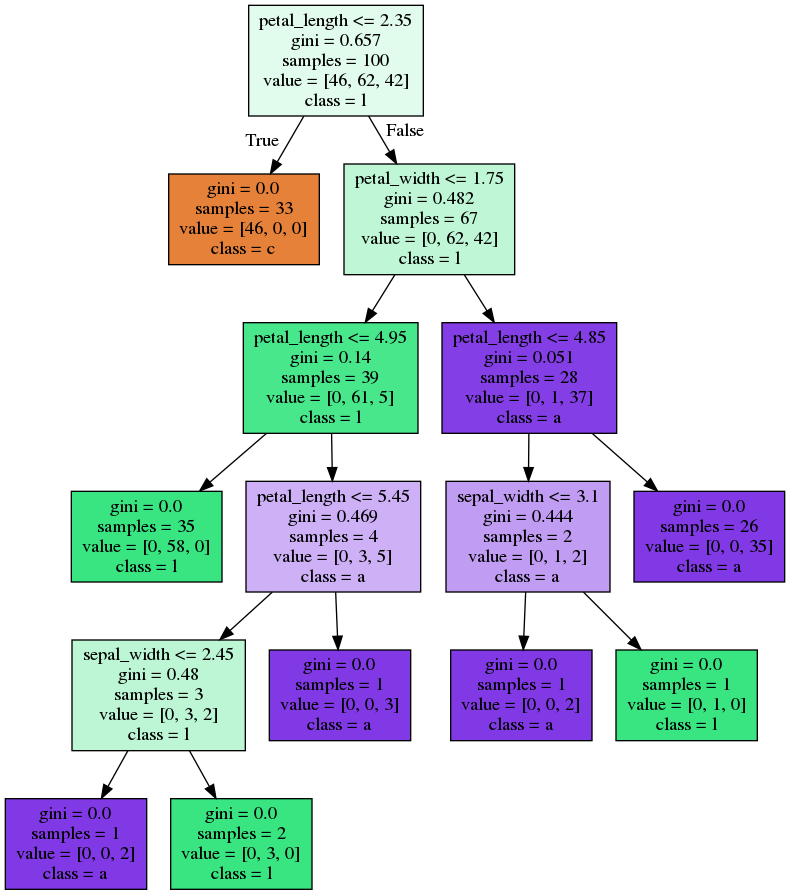
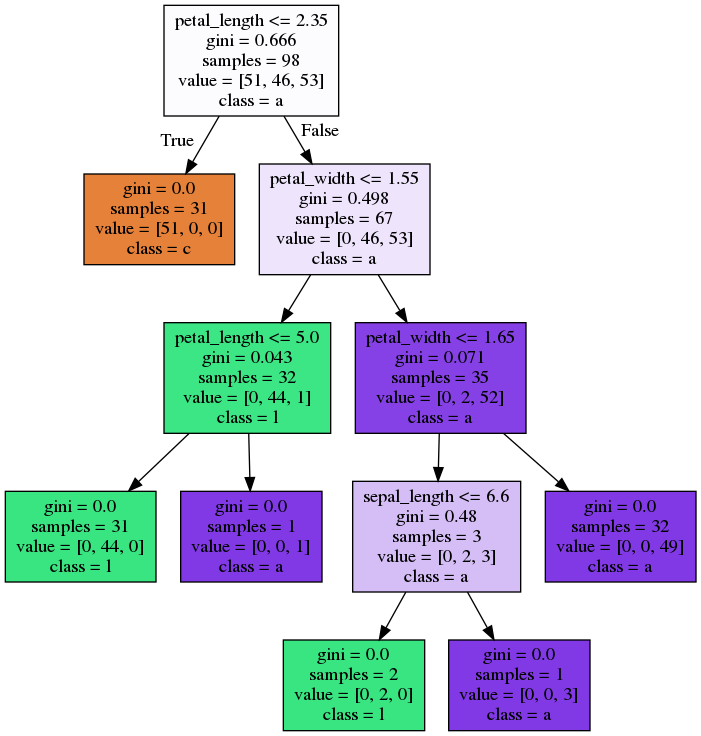
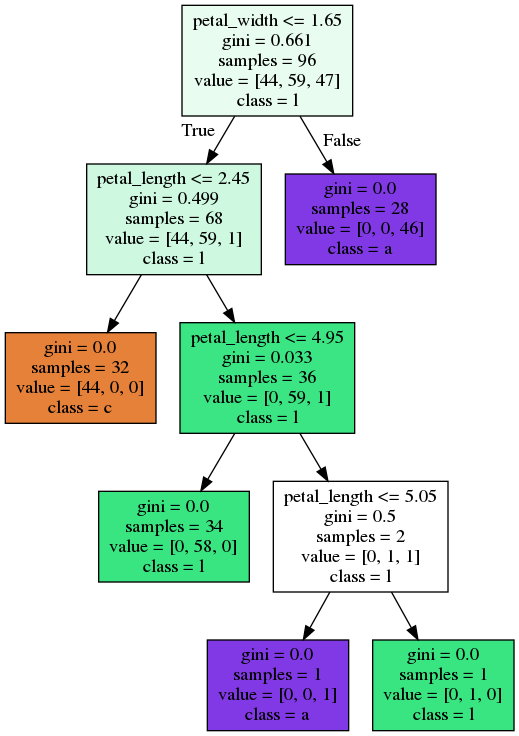
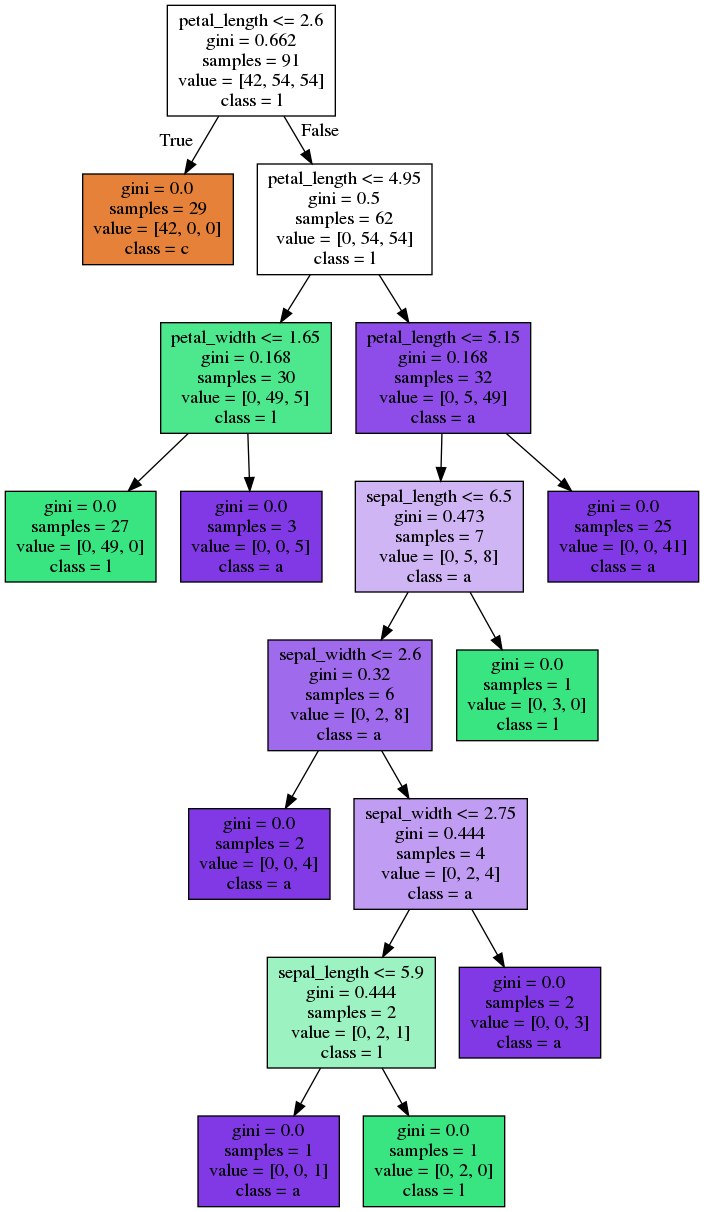
Bagging - Code
Bagging - Trees
Random Forest
- Original Paper
-
Builds on bagging
-
Many trees (aggregate)
- Each tree built from a sample of values (bootstrap)
-
Each split picks from a
random subset of predictors
- Usually $ \sqrt{n} $
- $n = $ number of predictors
-
Many trees (aggregate)
›
Random Forest - Variable Importance
-
Impurity Based feature importance (Gini importance)
-
sklean.ensemble.RandomForestClassifier.feature_importances_ - Uses the out-of-bag error 🤷
- Biased toward categorical predictors with high cardinality
-
-
Permutation based feature importance
-
sklearn.inspection.permutation_importance - Will actually work with any classifier!
-
›
In Summary
-
Features
- Continuous: Easy
-
Categorical: Harder
- One-hot
- Dummy
- Ranking
- Embedding
- Vector
-
Feature Engineering
- Best way to increase a model's accuracy
- Always plot predictons!
-
Variable Importance rankings
- p-value & z/t score
- Difference with mean of response
- Random Forest variable importance